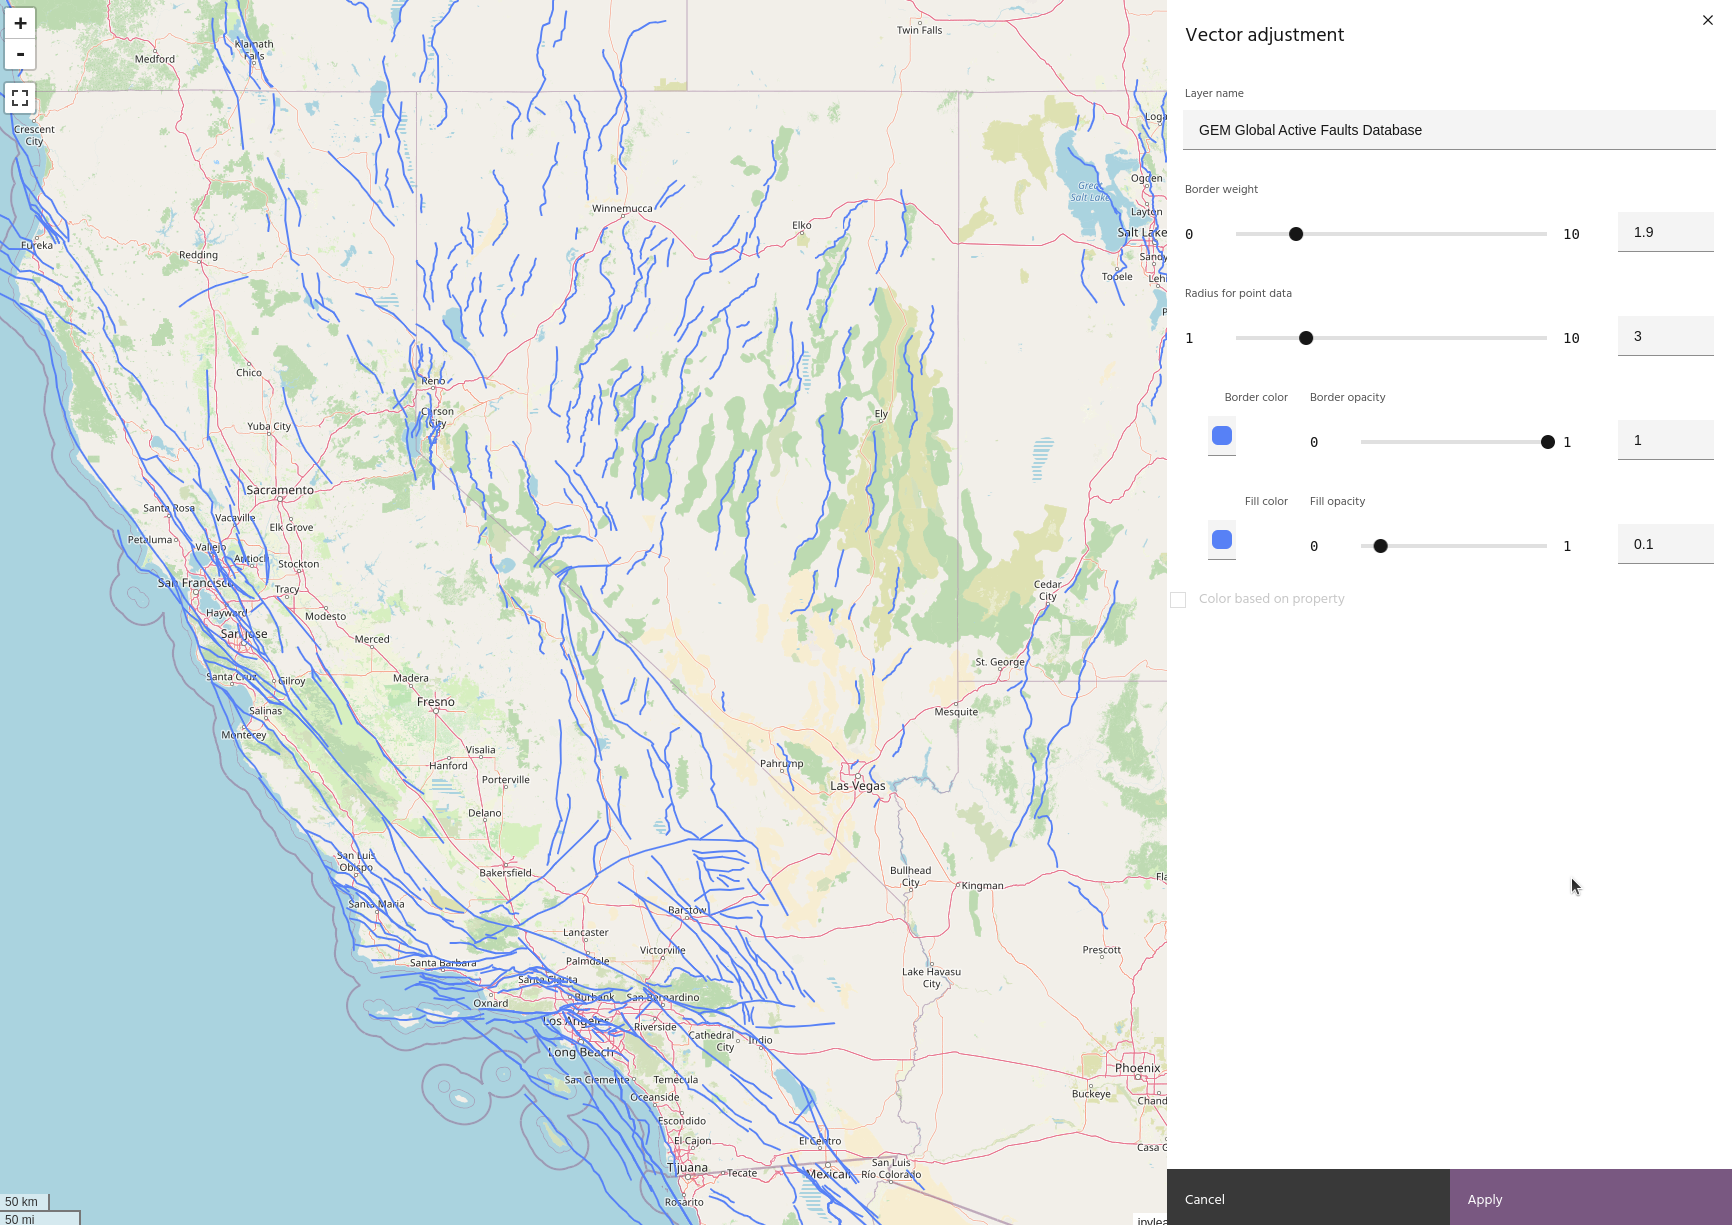
Vector layer settings
As with raster layers, vector layers have a settings dialog to modify visualization properties of the layer.
Tip
The layer will update dynamically as you change settings, but you can always
undo your changes with the Cancel button!
Rename a layer
Modify the Layer name field to change the name of the layer. The name will
change in the list automatically.
Border weight
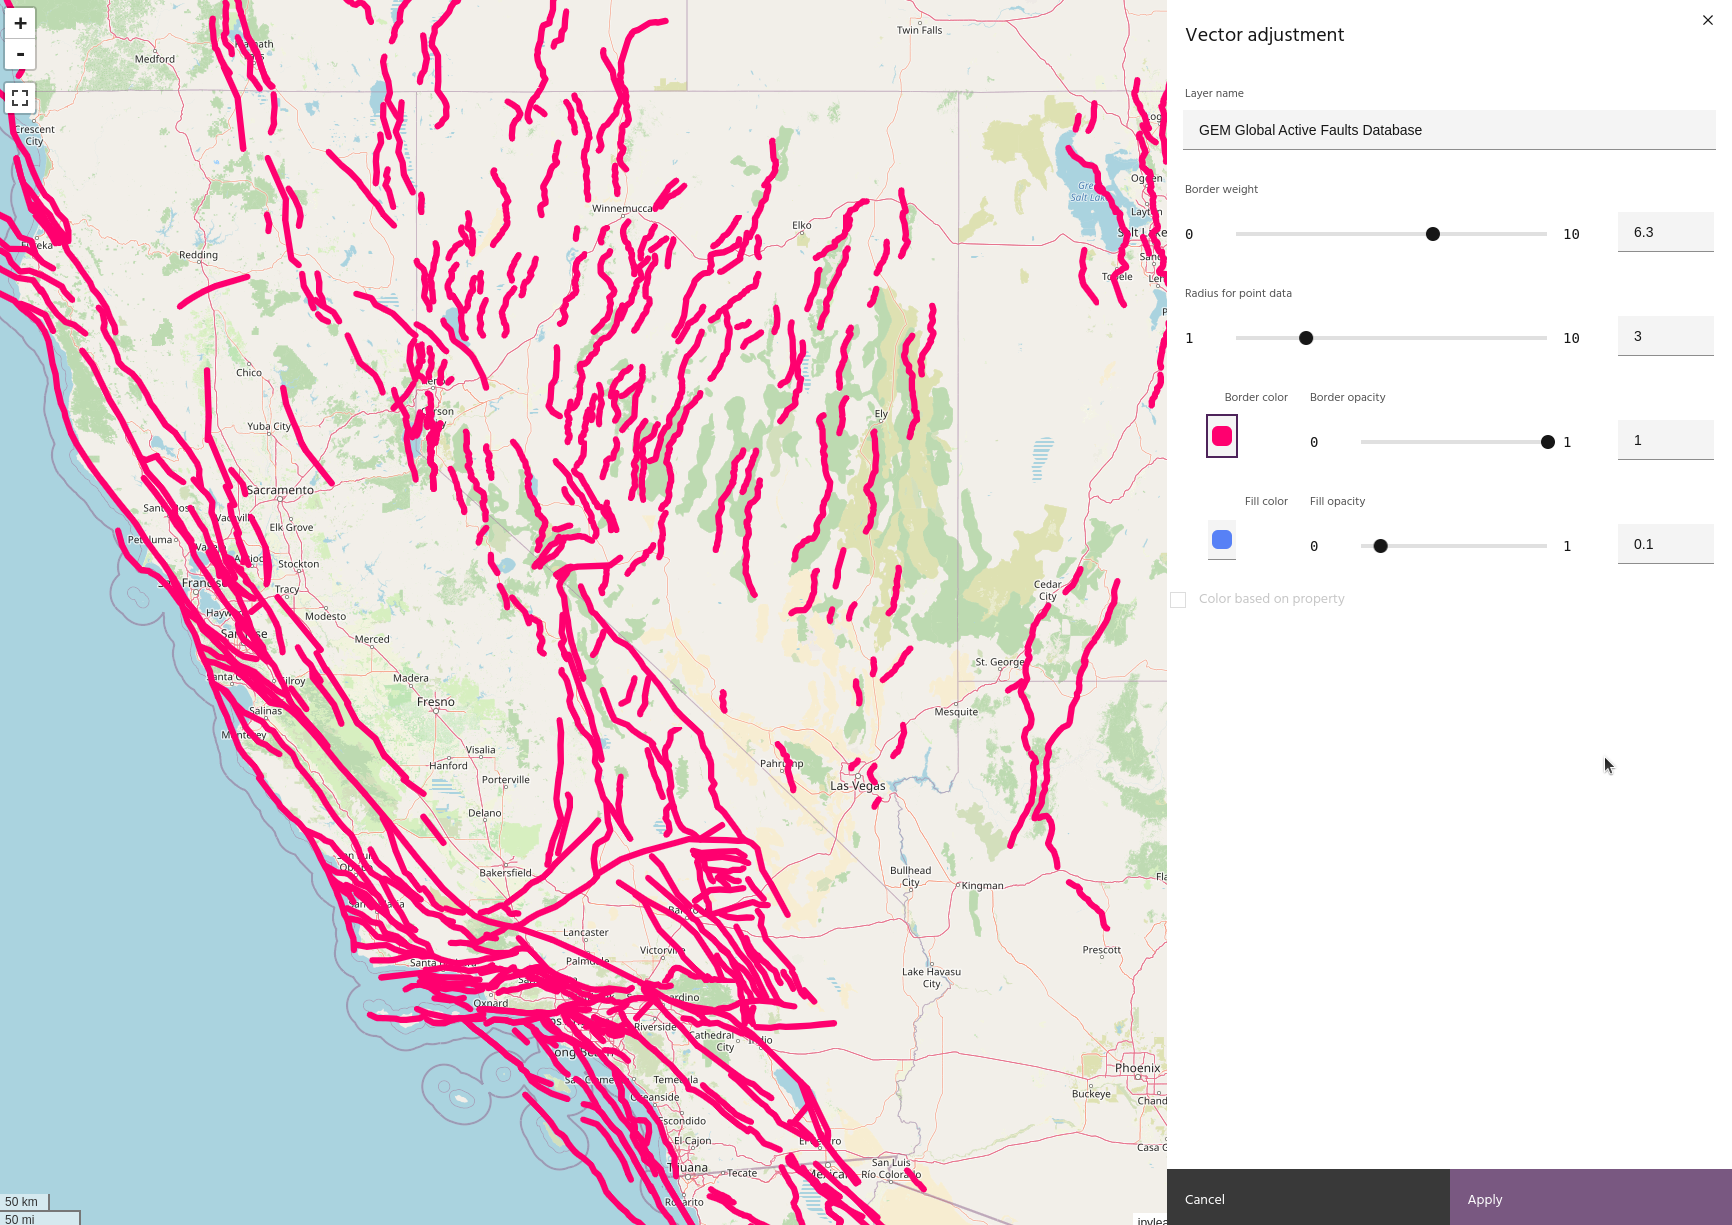
Adjust the weight of the border lines of the vector.
Radius for point data
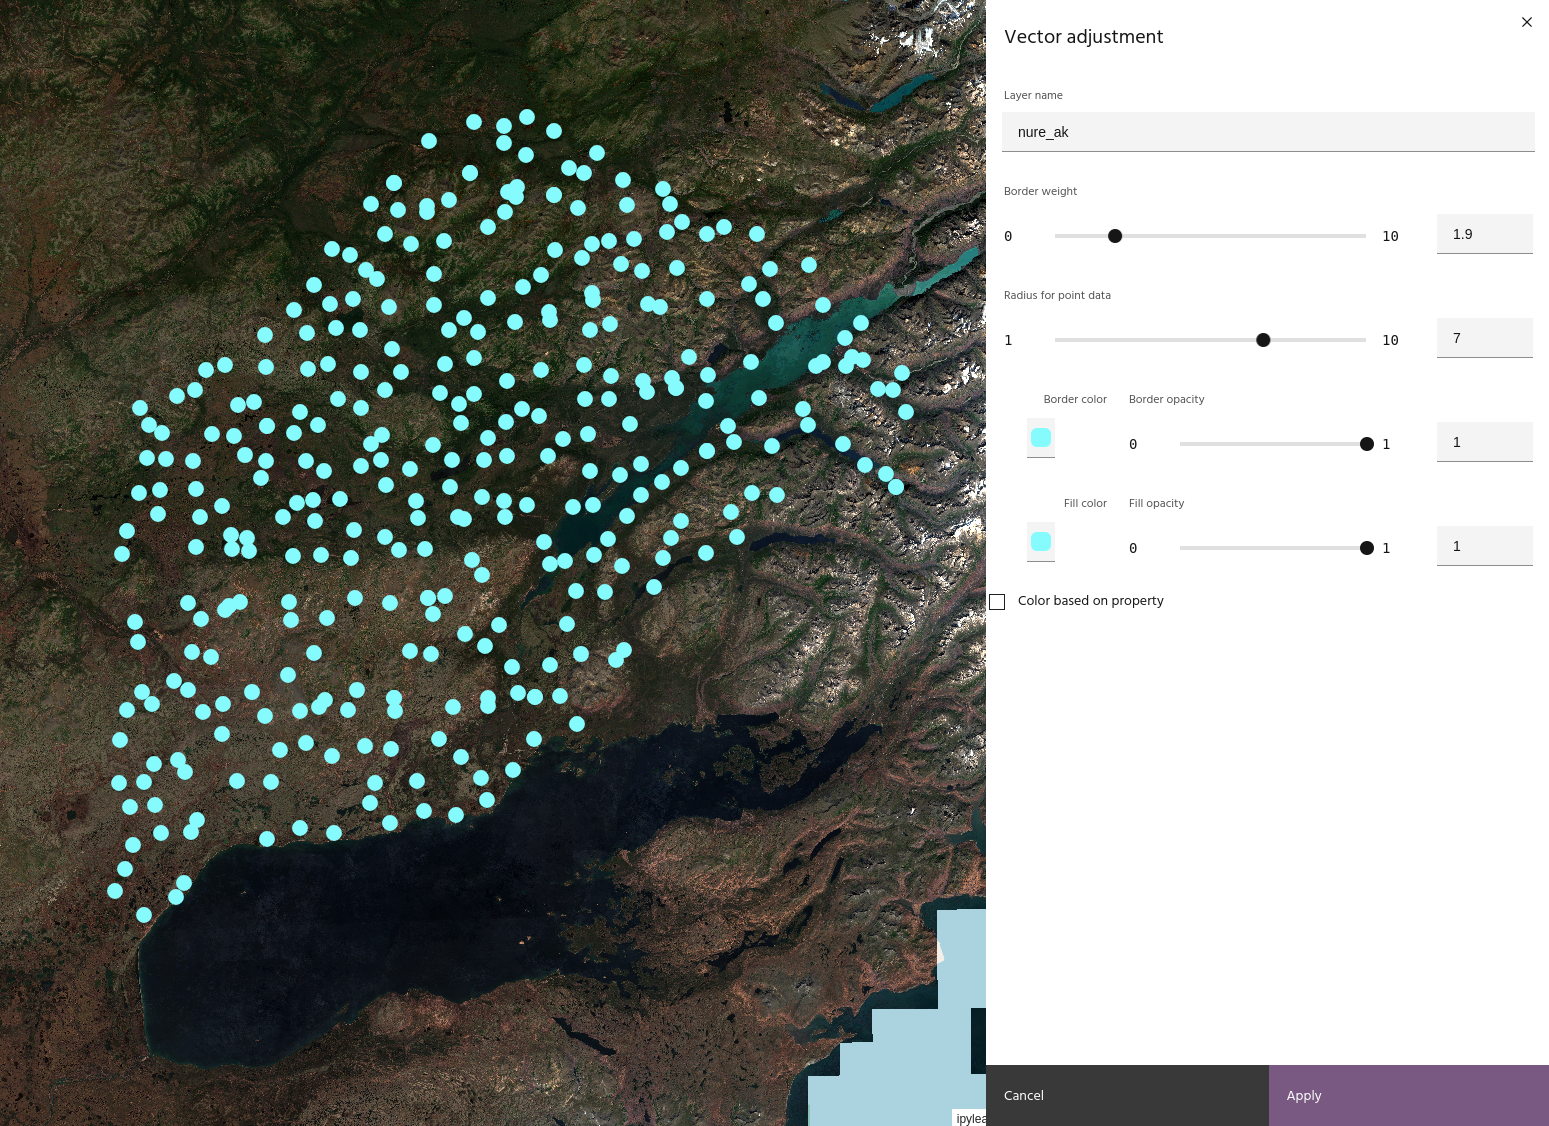
Adjust the radius for point data.
Border and fill color and opacity
Adjust the border and fill color and opacity.
Note
Fill color and opacity only have meaning for point or polygon layers
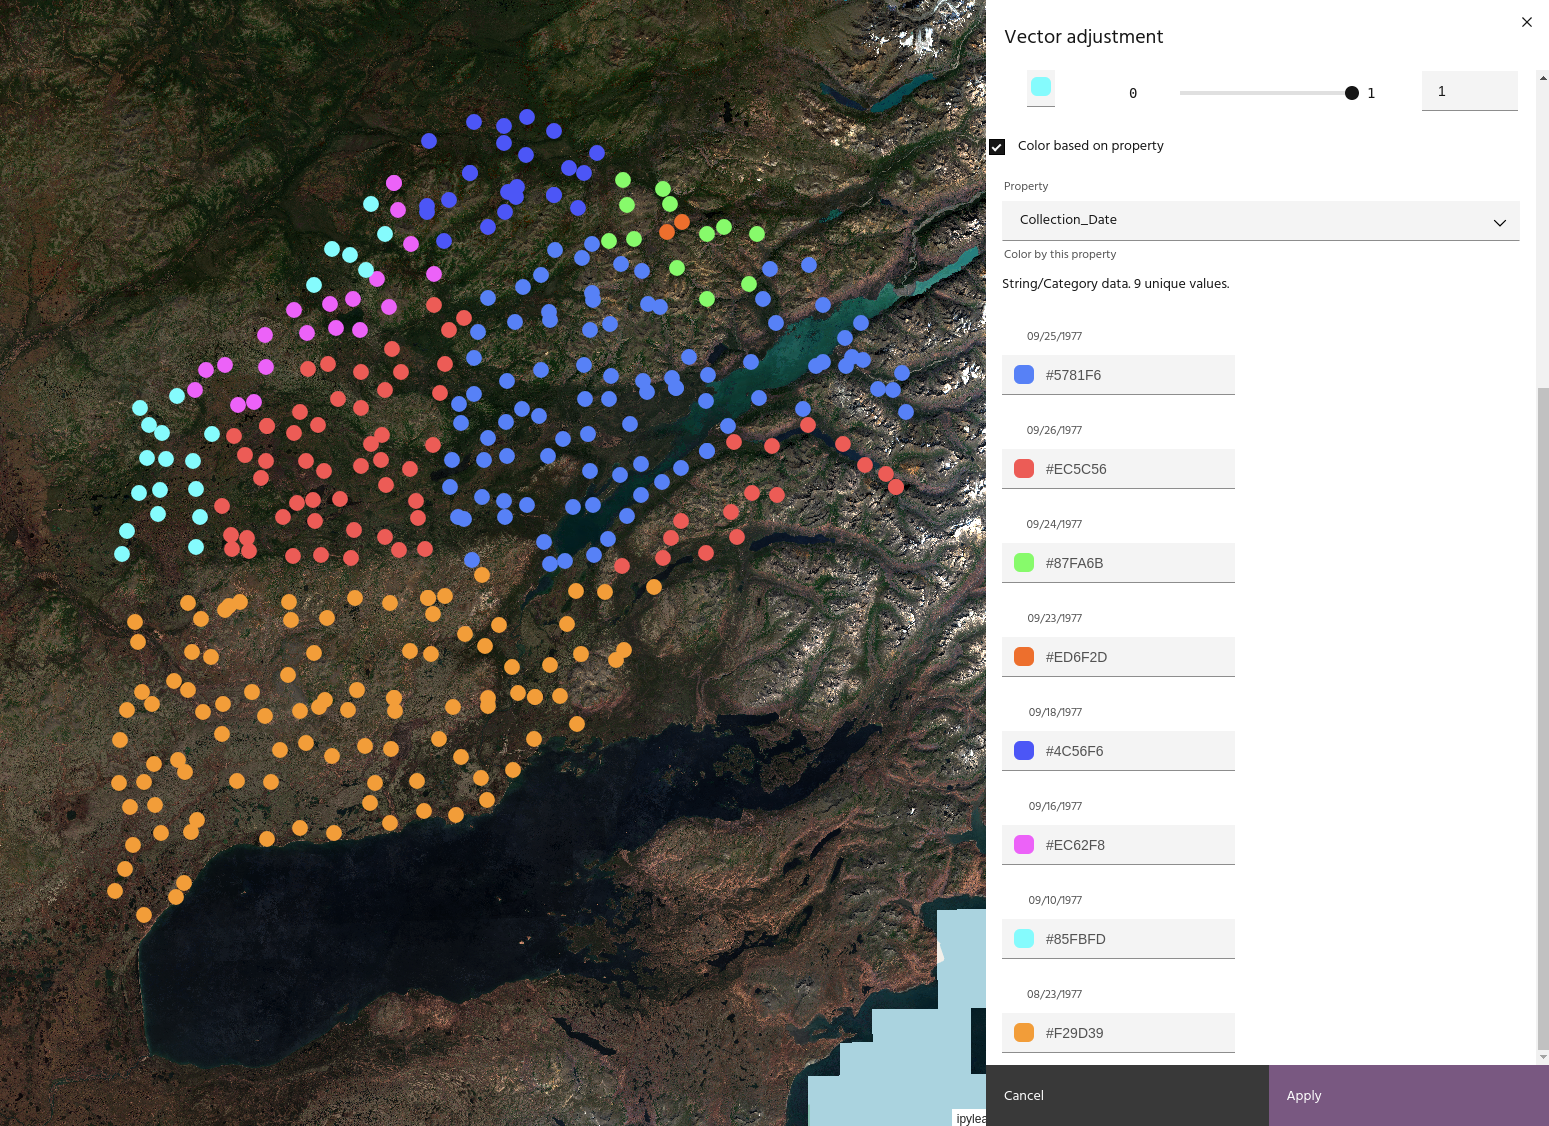
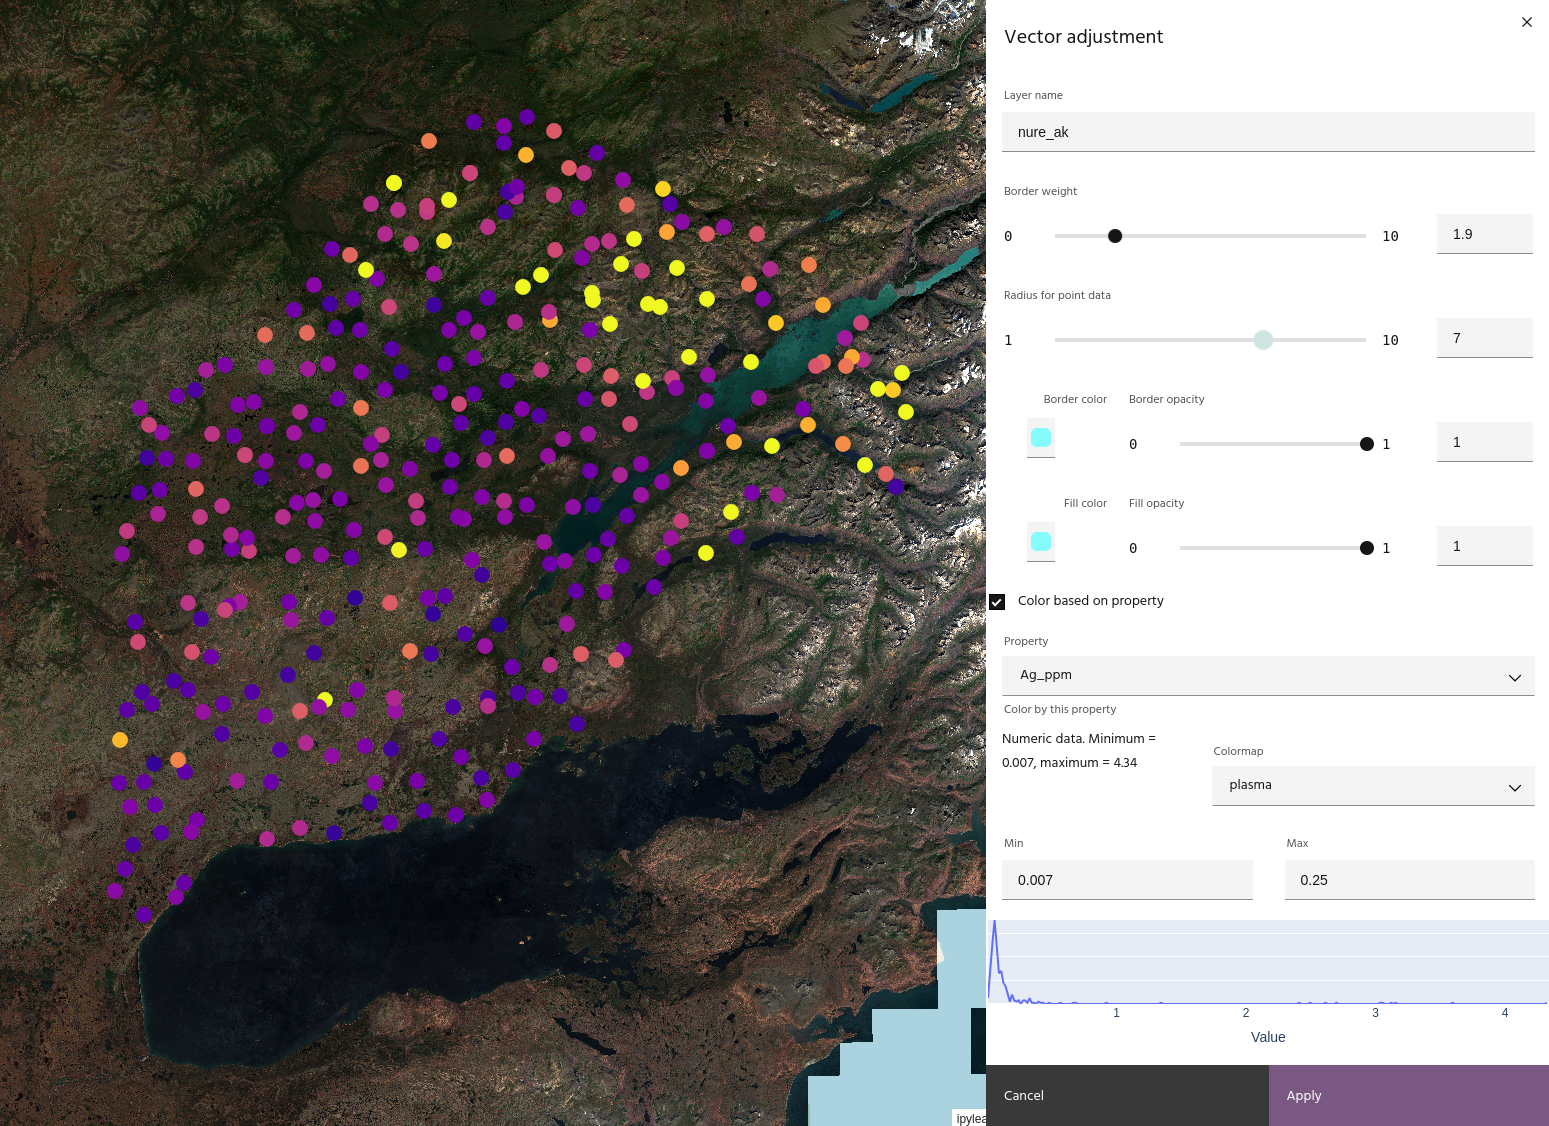
Color by property
If your vector data has properties, such as geochemical samples or geologic units, the properties can be used for coloring the layer.
Marigold will attempt to determine whether the property is continuous or categorical. For continuous data, a histogram of the property values will be shown. Choose the min and max values along with a colorbar to plot the data in that color.
Warning
Coloring using date properties may not have the desired effect due to the way different systems handle date formatting.
Categorical data will show a list of the categories and color values for each one. Color values can be modified by clicking on the box.