The Marigold header bar
The header bar in Marigold contains several tools for managing your project, such as saving and loading, manipulating the map, and links to further information on Marigold itself.

Save and load a project
Buttons for saving and loading projects. More information can be found here.
Bookmarks
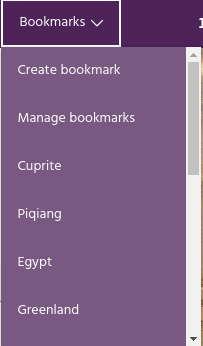
Bookmarks are a convenient way to store locations that you will return to often.
Each bookmark is defined by a latitude/longitude location and a zoom level.
Clicking on a bookmark will move the map to the defined center and zoom. Click
Create a bookmark to add the current map location as a bookmark, or click
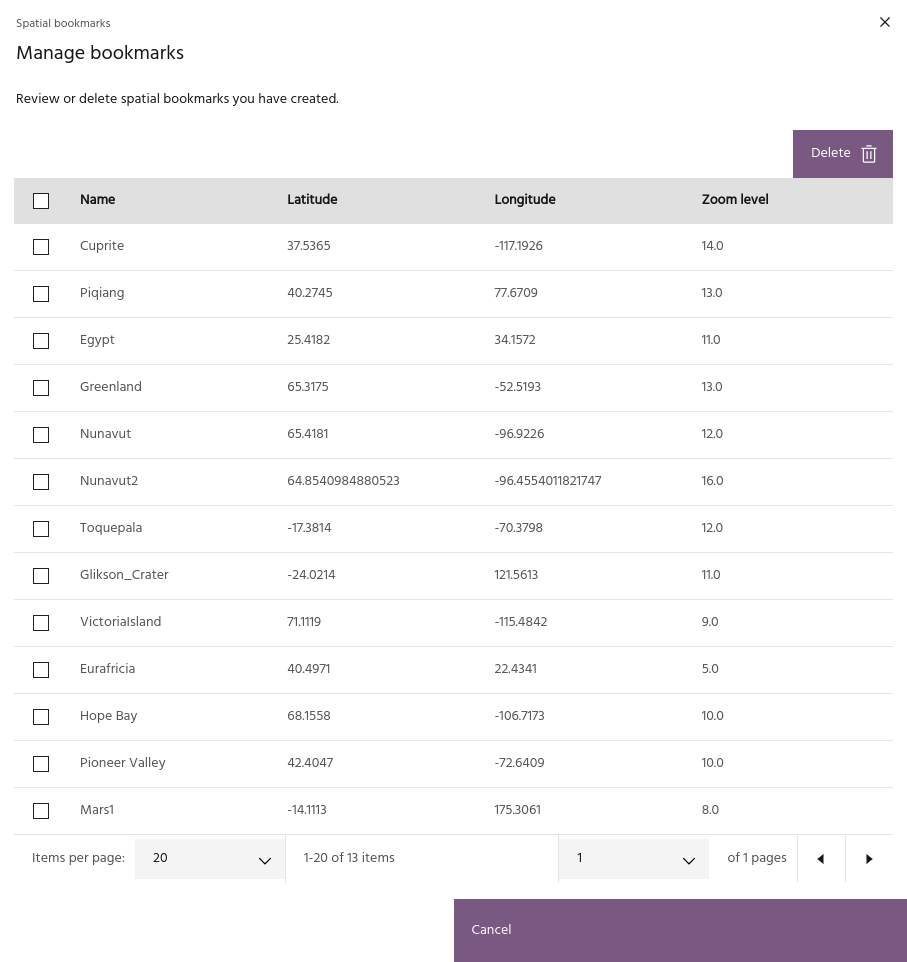
Manage bookmarks to review and manage your current bookmarks.
Zoom and center

Controls the center latitude/longitude value and zoom level of the map.
Warning
While Marigold allows you to zoom out to a continent-scale view, doing so can use a large amount of unexpected compute resources. By default, zooming past level 9 will automatically turn off all layers to avoid this, although they can be manually turned back on if you require a continent-scale display. The specific zoom level can be defined in your settings.
User settings


Several settings are available for users to modify to personalize their Marigold sessions. The first group of settings will persist between sessions, while the others will control behavior for the current session.
Global settings
- Default bookmark: When loading Marigold, the splash screen will default to this location.
- Default basemap: The default basemap to use on the map.
- Legend position: relative position on the map display for layer legends.
- Ternary legend size: size of the legend for ternary (RGB) layers.
Note
Legends already on the map will need to be toggled off and on again to see the changes.
Session settings
- Zoom level: level at which layers will automatically be hidden to lower costs.
- Autoscale defaults: default percentiles to use when autoscaling layers, and what AOI to pull data from. If Current viewport is chosen, it will be the window on your screen when clicking the autoscale button. If a vector is chosen, it will be this vector whenever you click the autoscale button.
Click Save settings to save the settings to your profile
Pixel inspector

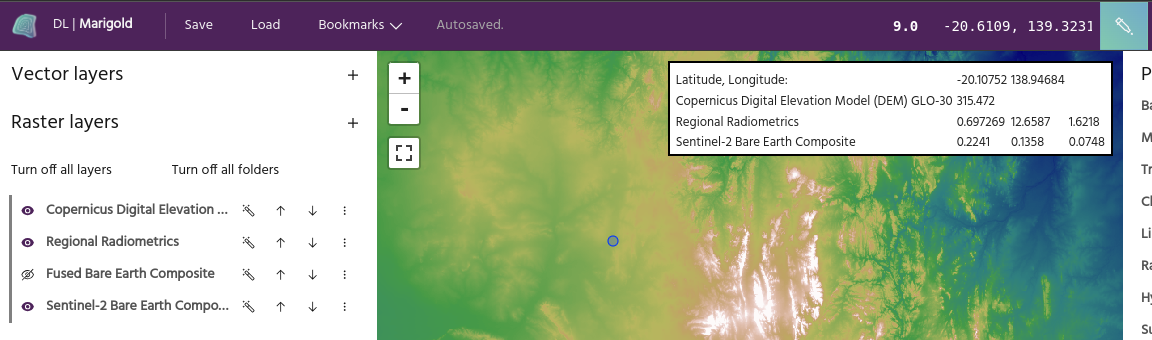
The pixel inspector will extract the pixel values for all currently visualized layers. Click the icon to start an inspector session, and click on the map to extract a point. Layers will appear in the same order as they are in the raster layer list. Clicking the map in another location will move the inspection point and recompute the values shown in the box.
Note
Only values for the currently visualized bands (either one or three, depending on if the layer is a single band or RGB display) will be computed with this tool. For detailed inspection of all of a layer's bands at single points, use the spectral query tool.
Tip
The pixel inspector will appear above tool dialogs so you can inspect values while running an analysis. This can be very useful for tools like the raster calculator, where you may want to identify specific pixel values.
Screenshot tool

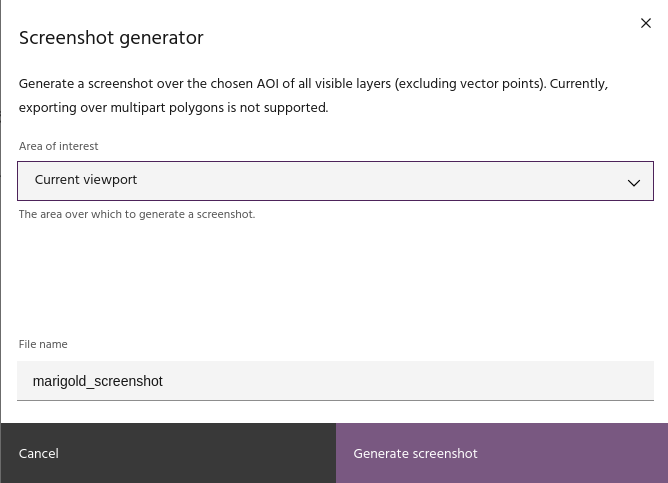
Use this tool to take a screenshot of the map over the selected AOI. All visible
raster and vector layers will be captured and output as a .png file on your
computer
Warning
This tool is provided for taking quick, repeatable screenshots of layers suitable for documentation, not for further data analysis. To output data layers at full resolution for use in other GIS packages, use the layer export functions.
Changelog

Click this icon to bring up the release notes for the most recent Marigold version.
Help

The help icon links to this documentation.
Onboarding videos

This icon links to a series of Marigold onboarding videos.