Spectral Query
Spectral information in a raster layer can be extracted in two ways: individual
points Spectral query, or the average over a vector. (Do
we need to write this every time? Probably, right?) Note that the bands need to
have their wavelength information stored in the Platform product. Data managed
by EDA, such as the Bare Earth Composites and public hyperspectral datasets,
have this by default. For personal products, ensure that at least the
wavelength_nm_center property is defined for all spectral bands. Contact
support for assistance with correctly loading data.
- From the
Spectraheader, selectSpectral query.
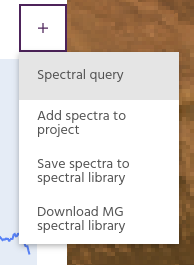
- Select the layer and bands to query.
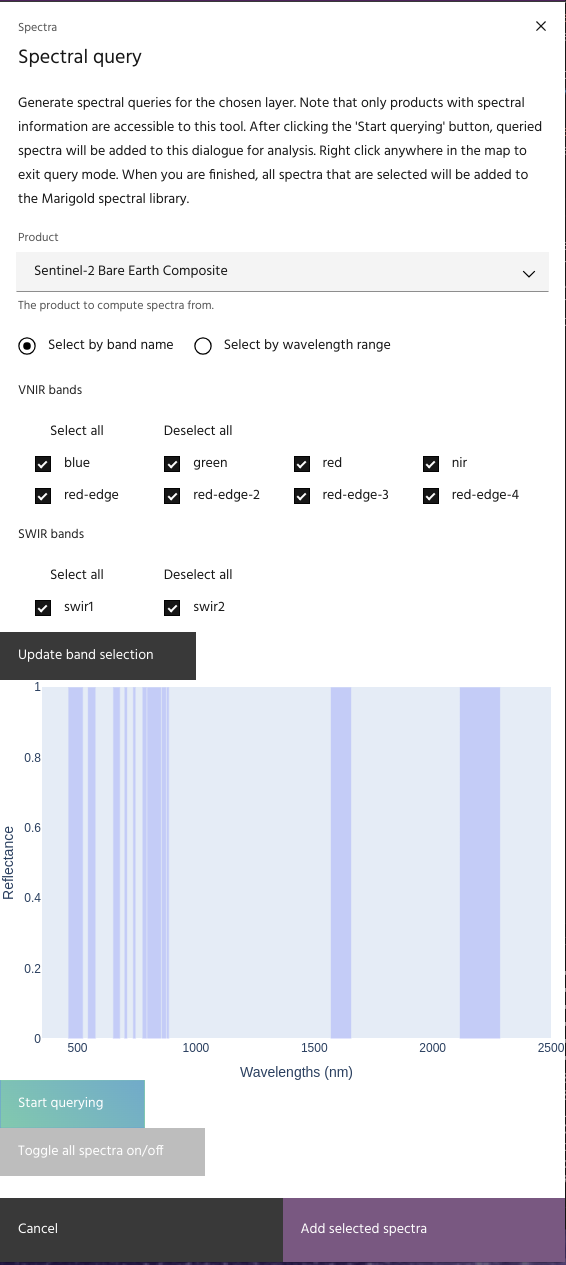
- Click
Start querying. The cursor will change to a crosshair to indicate that querying is enabled. - Clicking the map will extract the values of the chosen layer at the selected
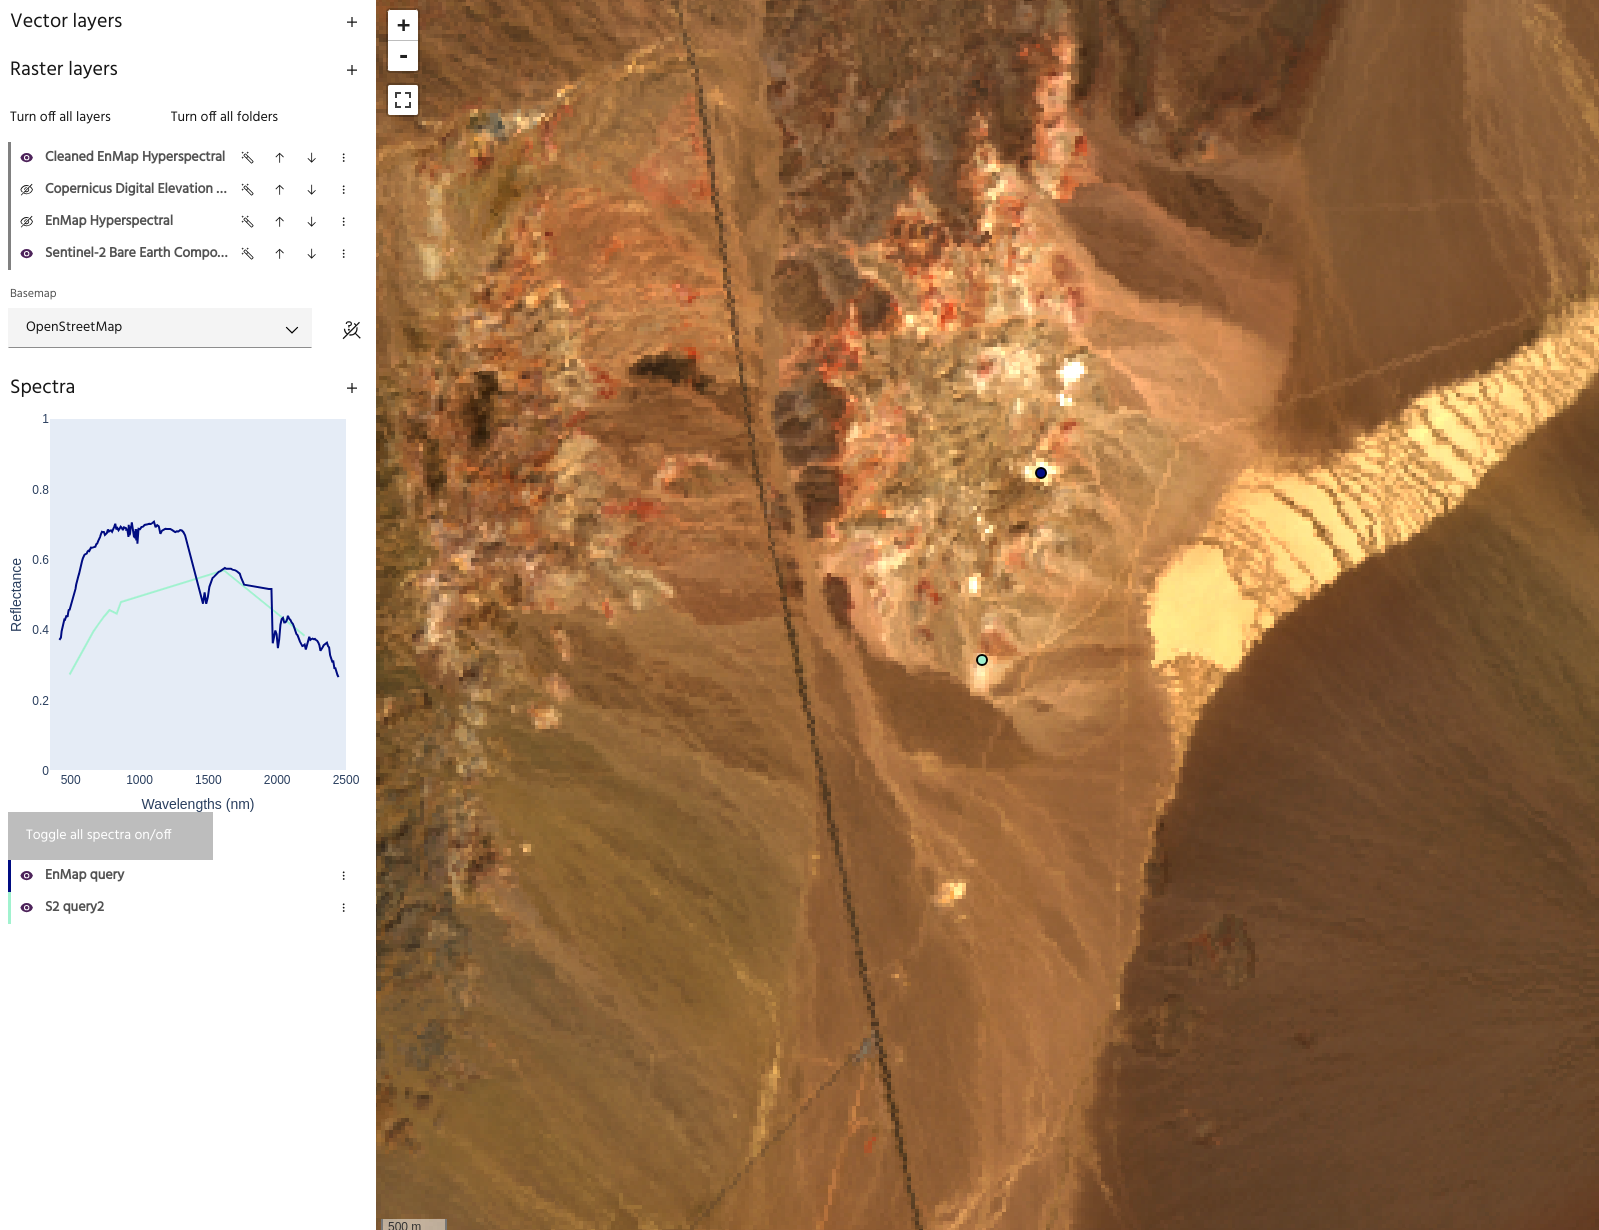
point and add it to the plot. Note that the color of the point on the map
will match the color of the spectrum in the plot.
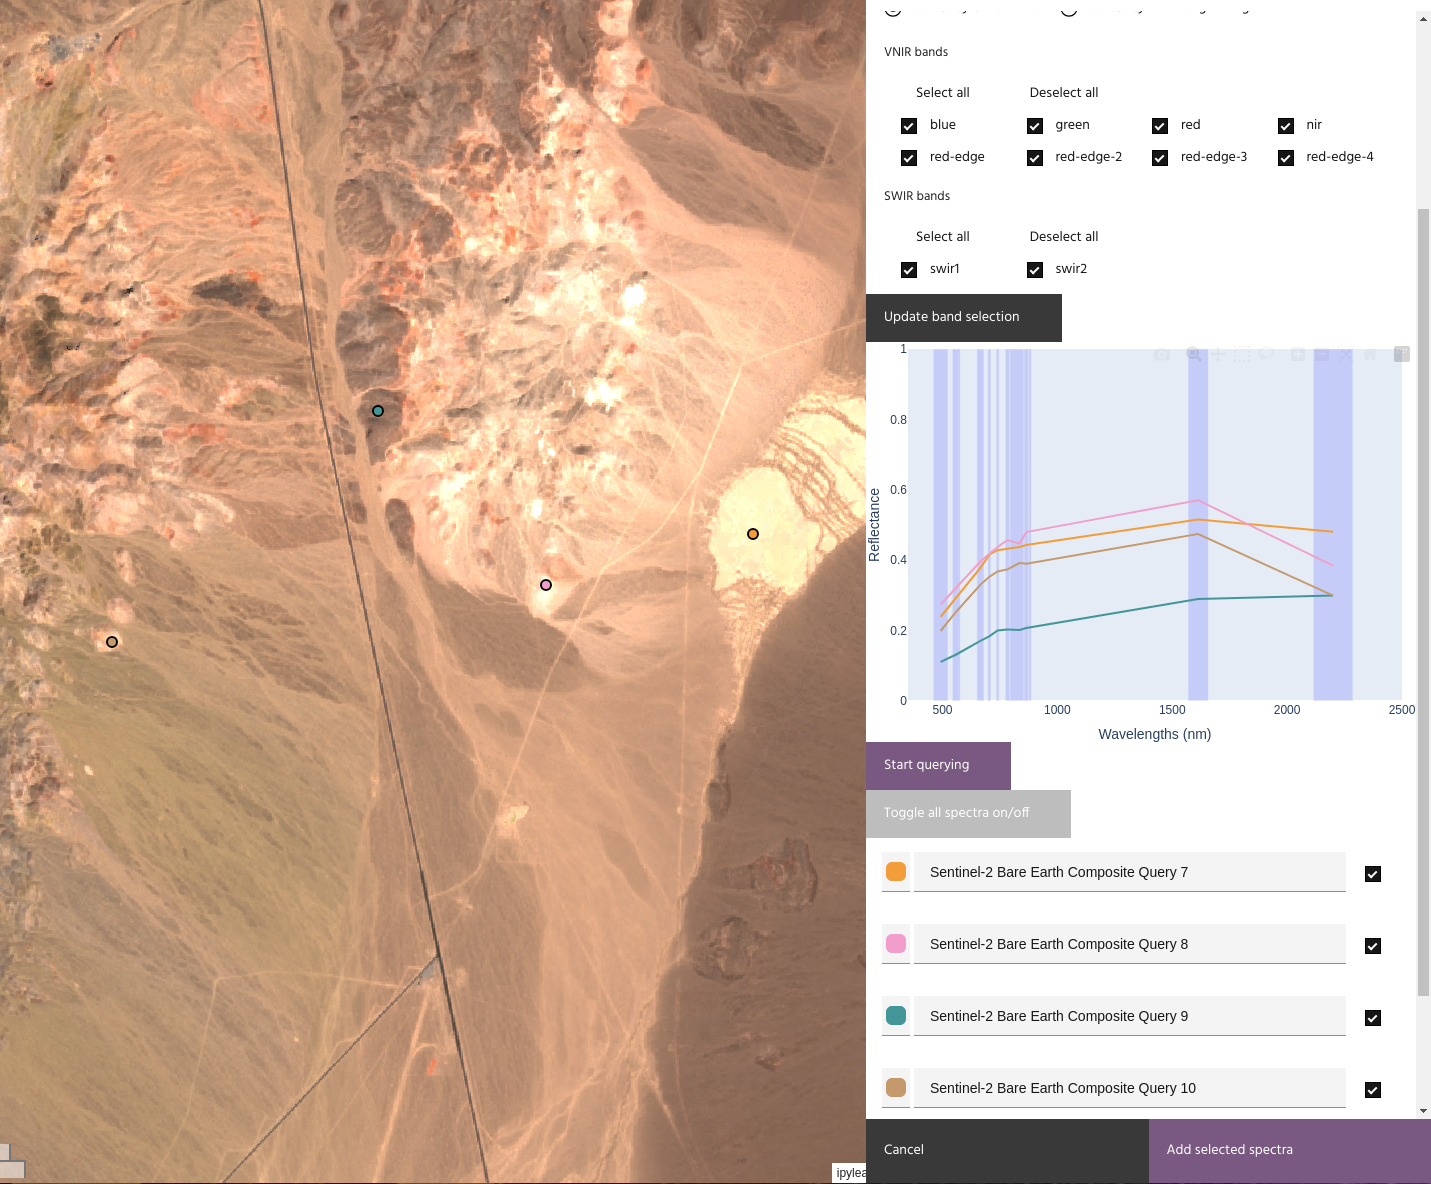
- Right clicking on the map will exit the querying session, and clicking
Start queryingagain will begin a new one. - Changing the layer or bands in the dialog will change the queried data going
forward.
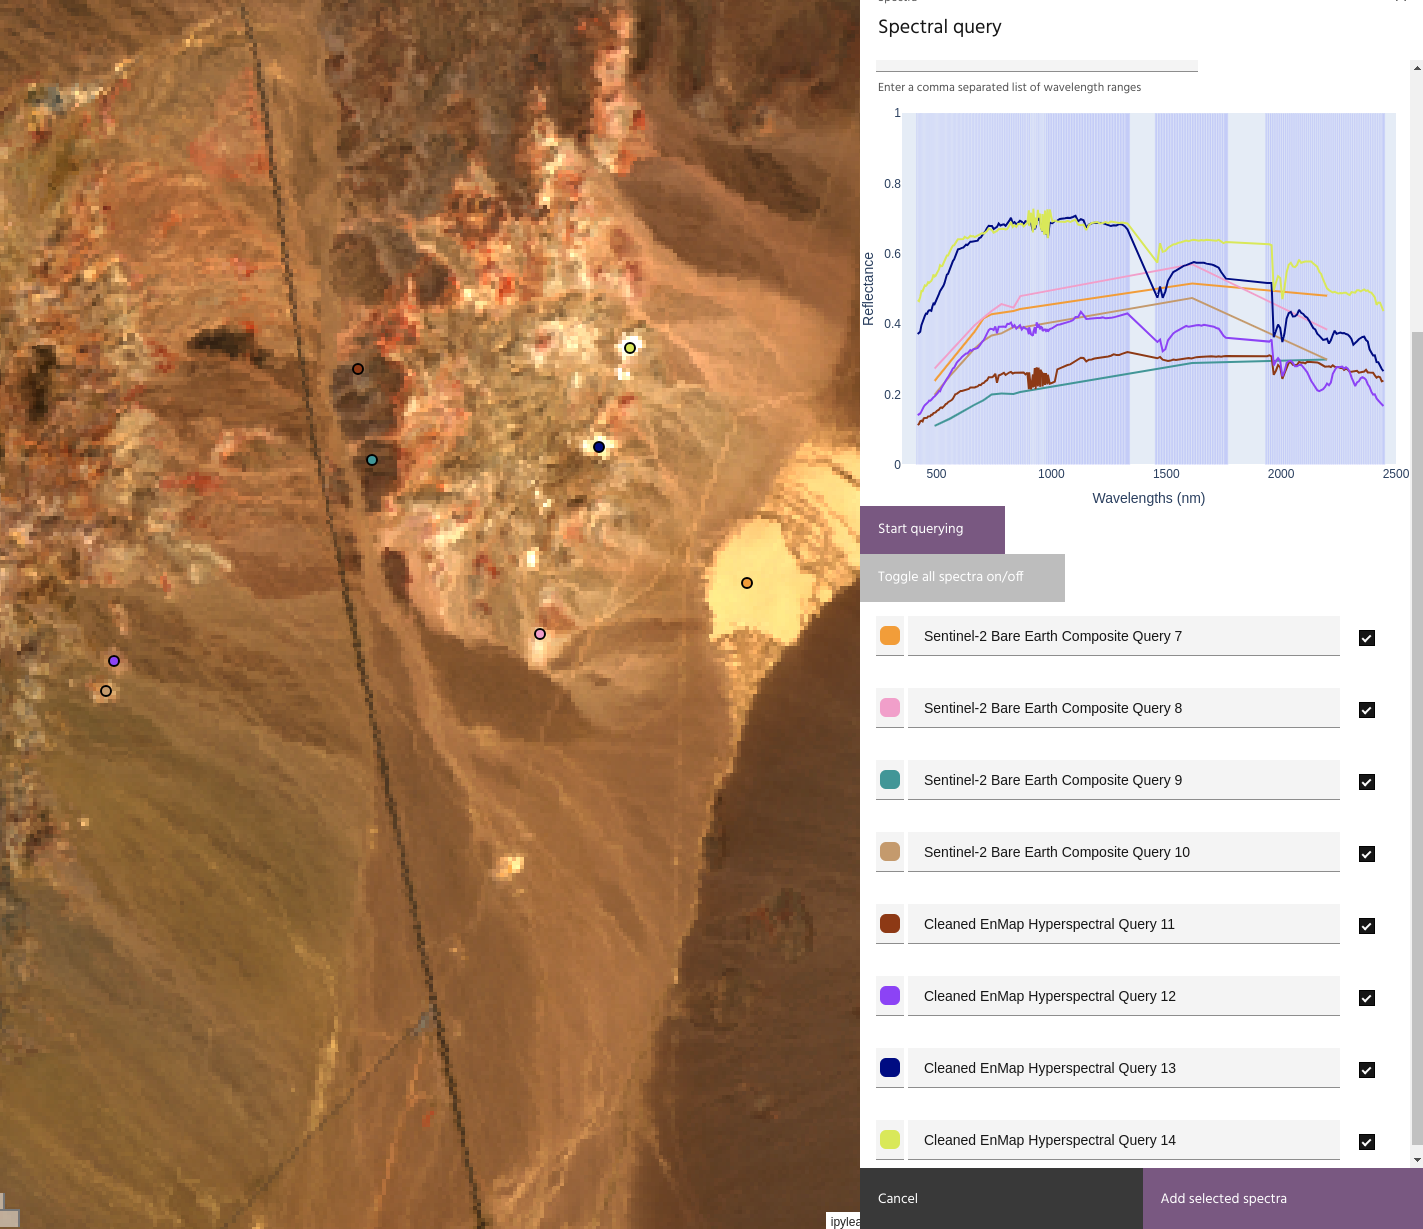
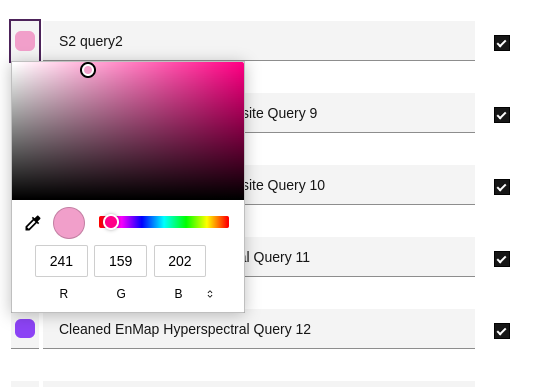
- Points can be renamed or given a different color.
- When all points have been queried, click
Add selected spectrato add all of the currently visible spectra to the project. Unselected spectra will not be added.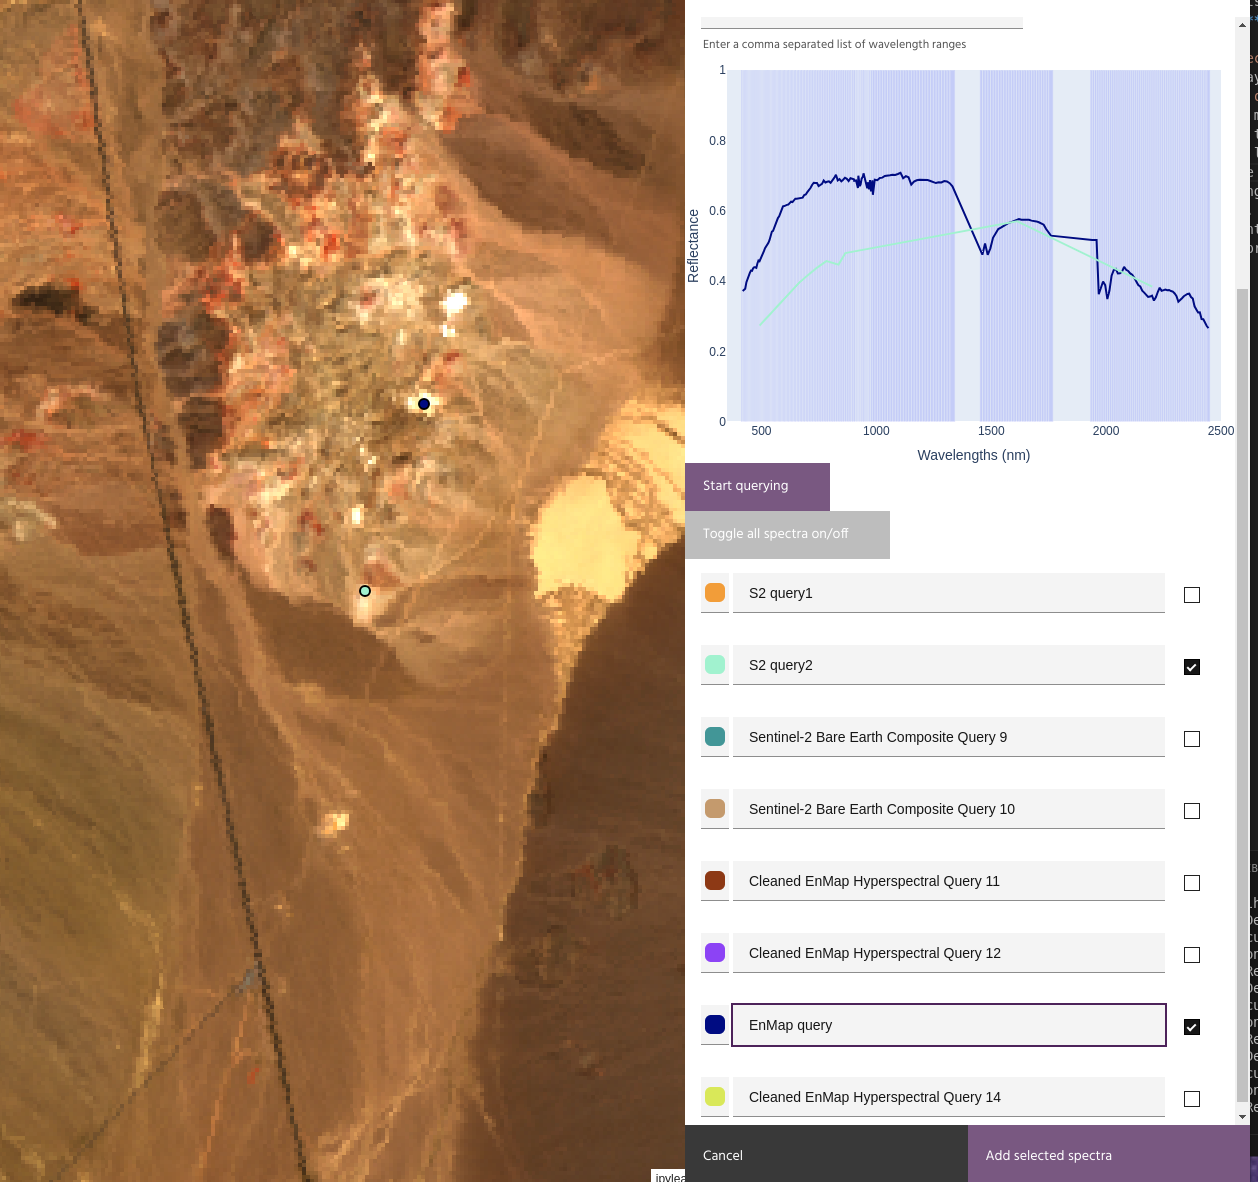
Tip
Point geometry associated with spectral queries can be downloaded using the overflow menu of the individual spectra.