Compute spectrum over vector
Spectral information in a raster layer can be extracted in two ways: individual
points (Spectral query), or the average over a vector. (Do
we need to write this every time? Probably, right?) Note that the bands need to
have their wavelength information stored in the Platform product. Data managed
by EDA, such as the Bare Earth Composites and public hyperspectral datasets,
have this by default. For personal products, ensure that at least the
wavelength_nm_center property is defined for all spectral bands. Contact
support for assistance with correctly loading data.
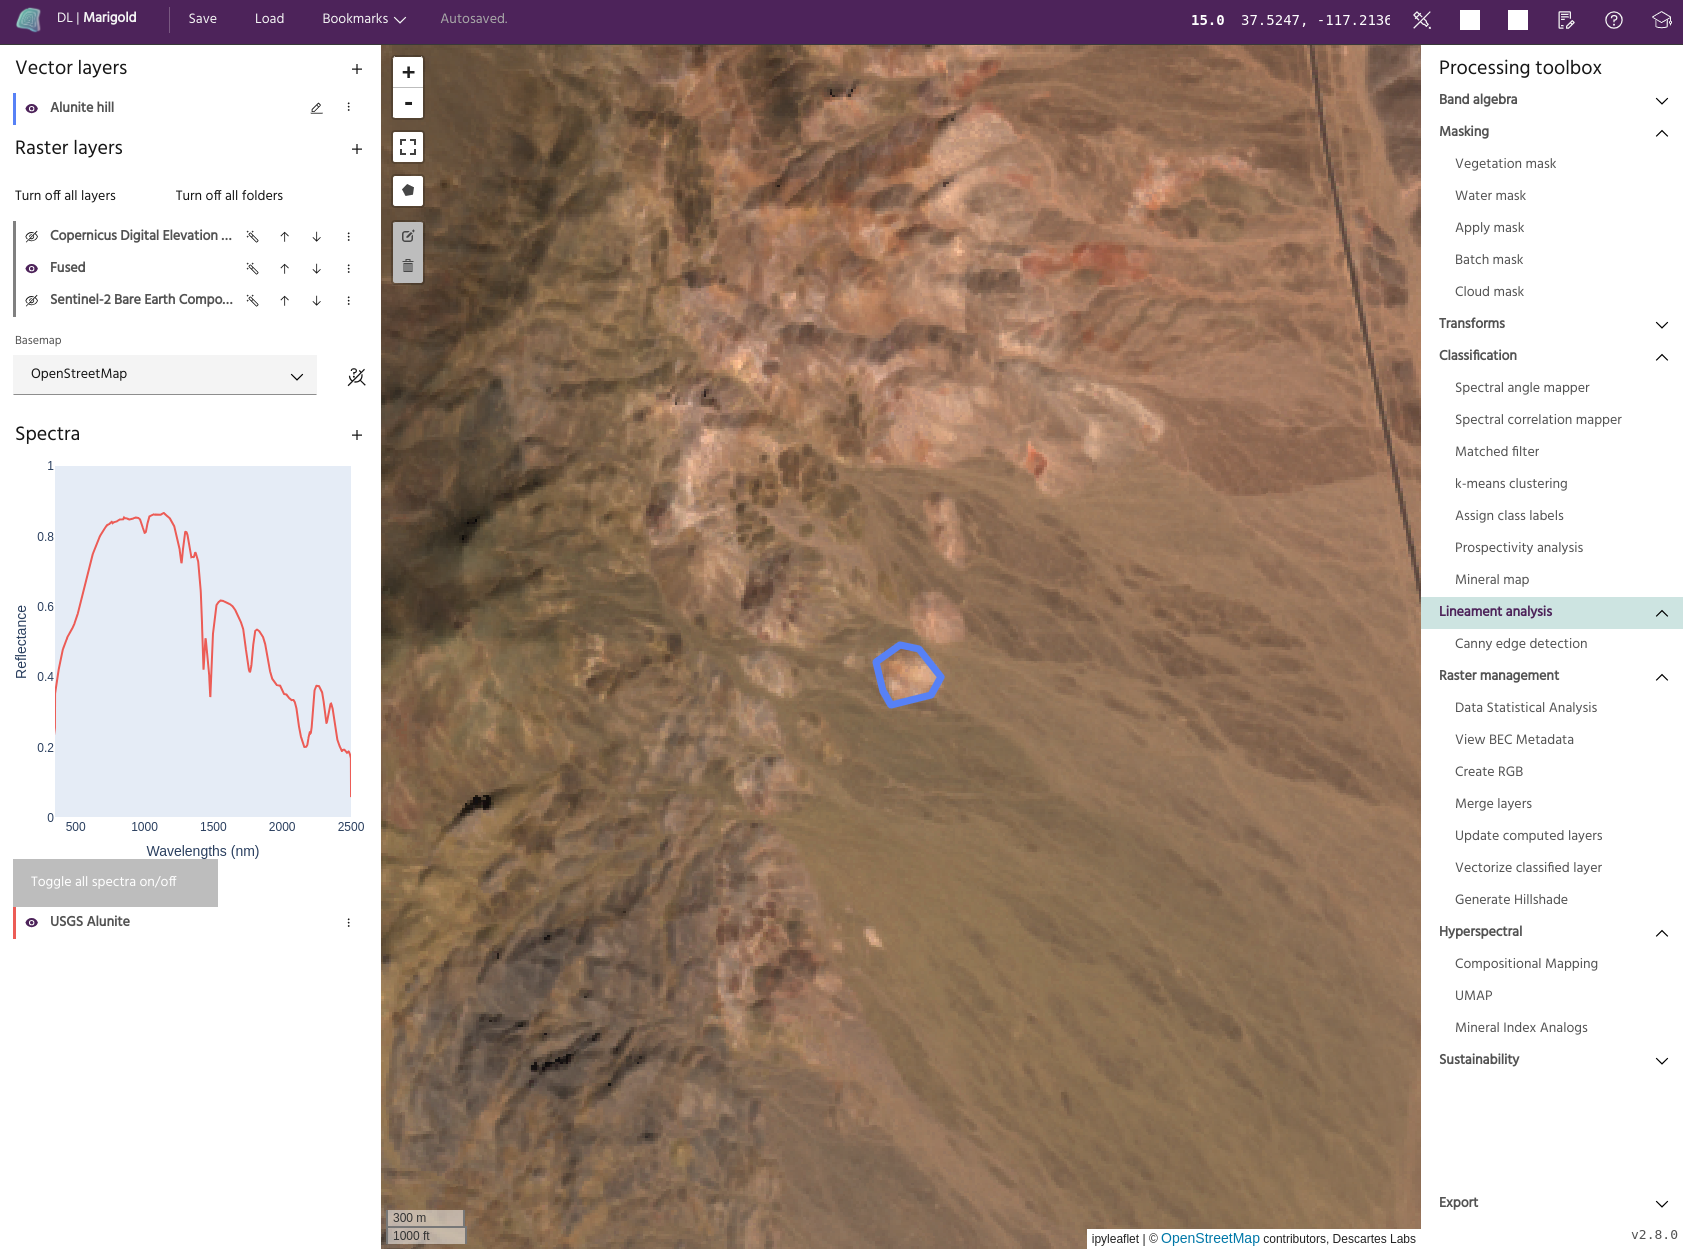
In this example, we will extract the spectrum of the Fused Bare Earth Composite
over Alunite Hill in the Cuprite region of Nevada.
- From
Spectraheader, selectAdd spectra to project.

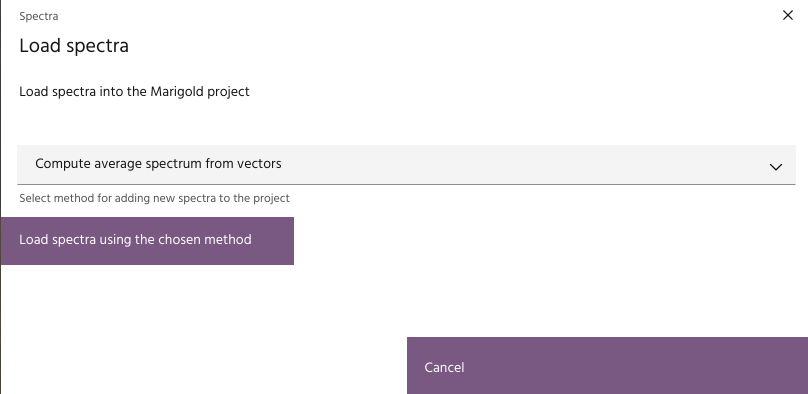
- From the dropdown, select
Compute average spectrum from vectorsand click theLoad spectra using the chosen methodbutton.
- Choose the raster layer to extract a spectrum from, and the bands to use.
- Choose at least one target vector. One spectrum will be computed for each AOI
chosen.
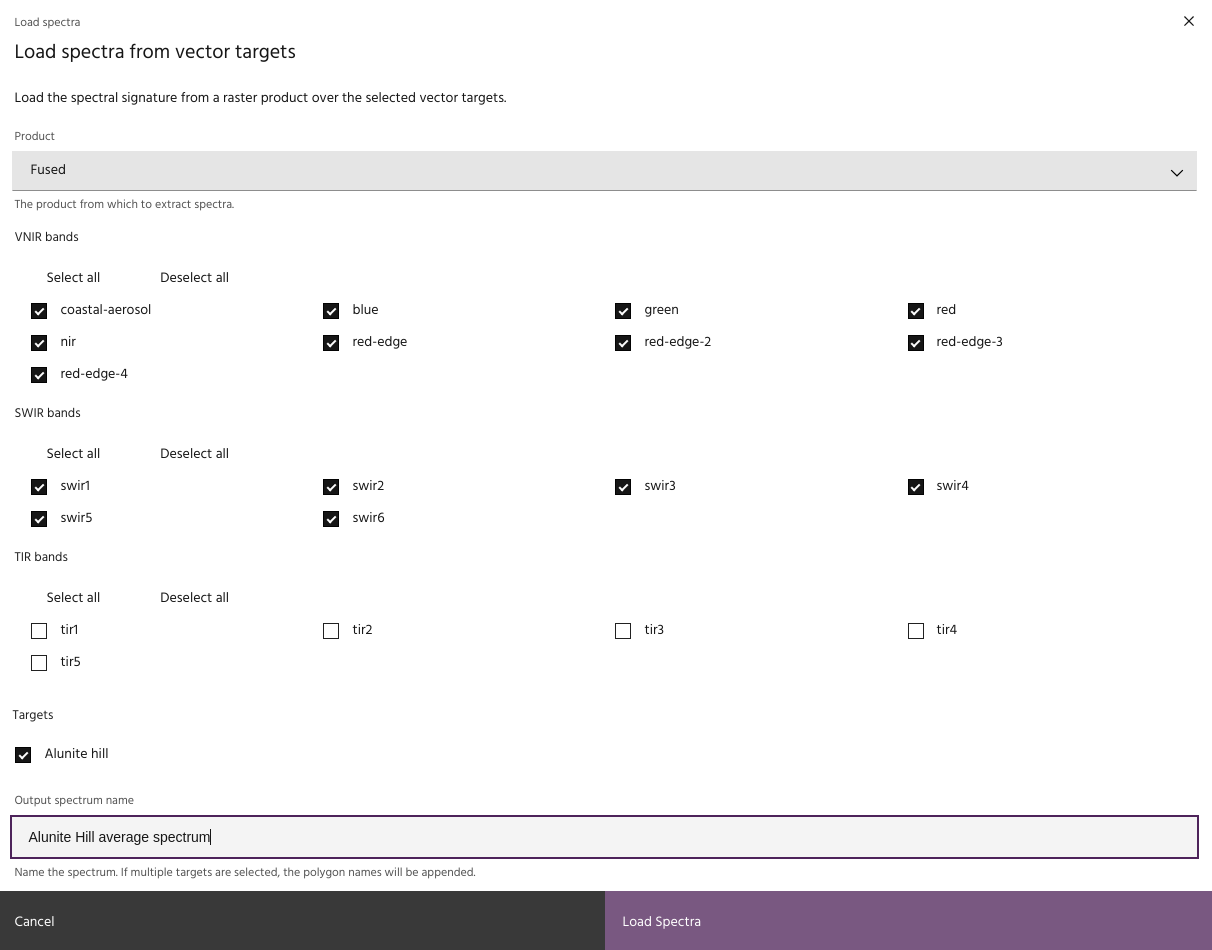
- Name the spectrum and select Load spectra. The vector name will be appended
to each spectrum computed. The spectrum is now available for use.
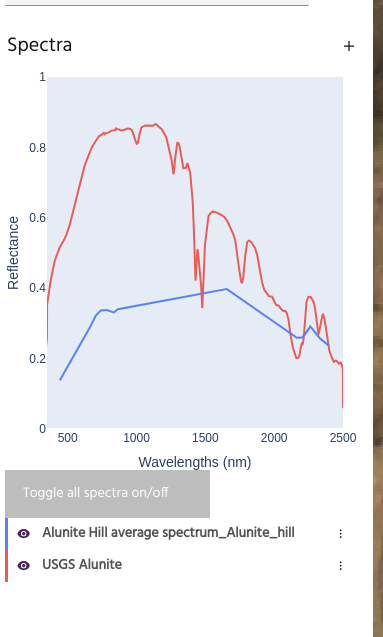
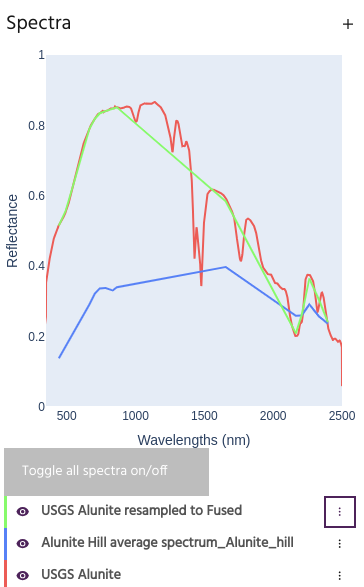
Note that the computed spectrum is at a much lower resolution than the lab
spectrum from the USGS library. To obtain a better comparison, we can
resample the lab spectrum to the bands of the
Fused Bare Earth Composite.