Compositional mapping
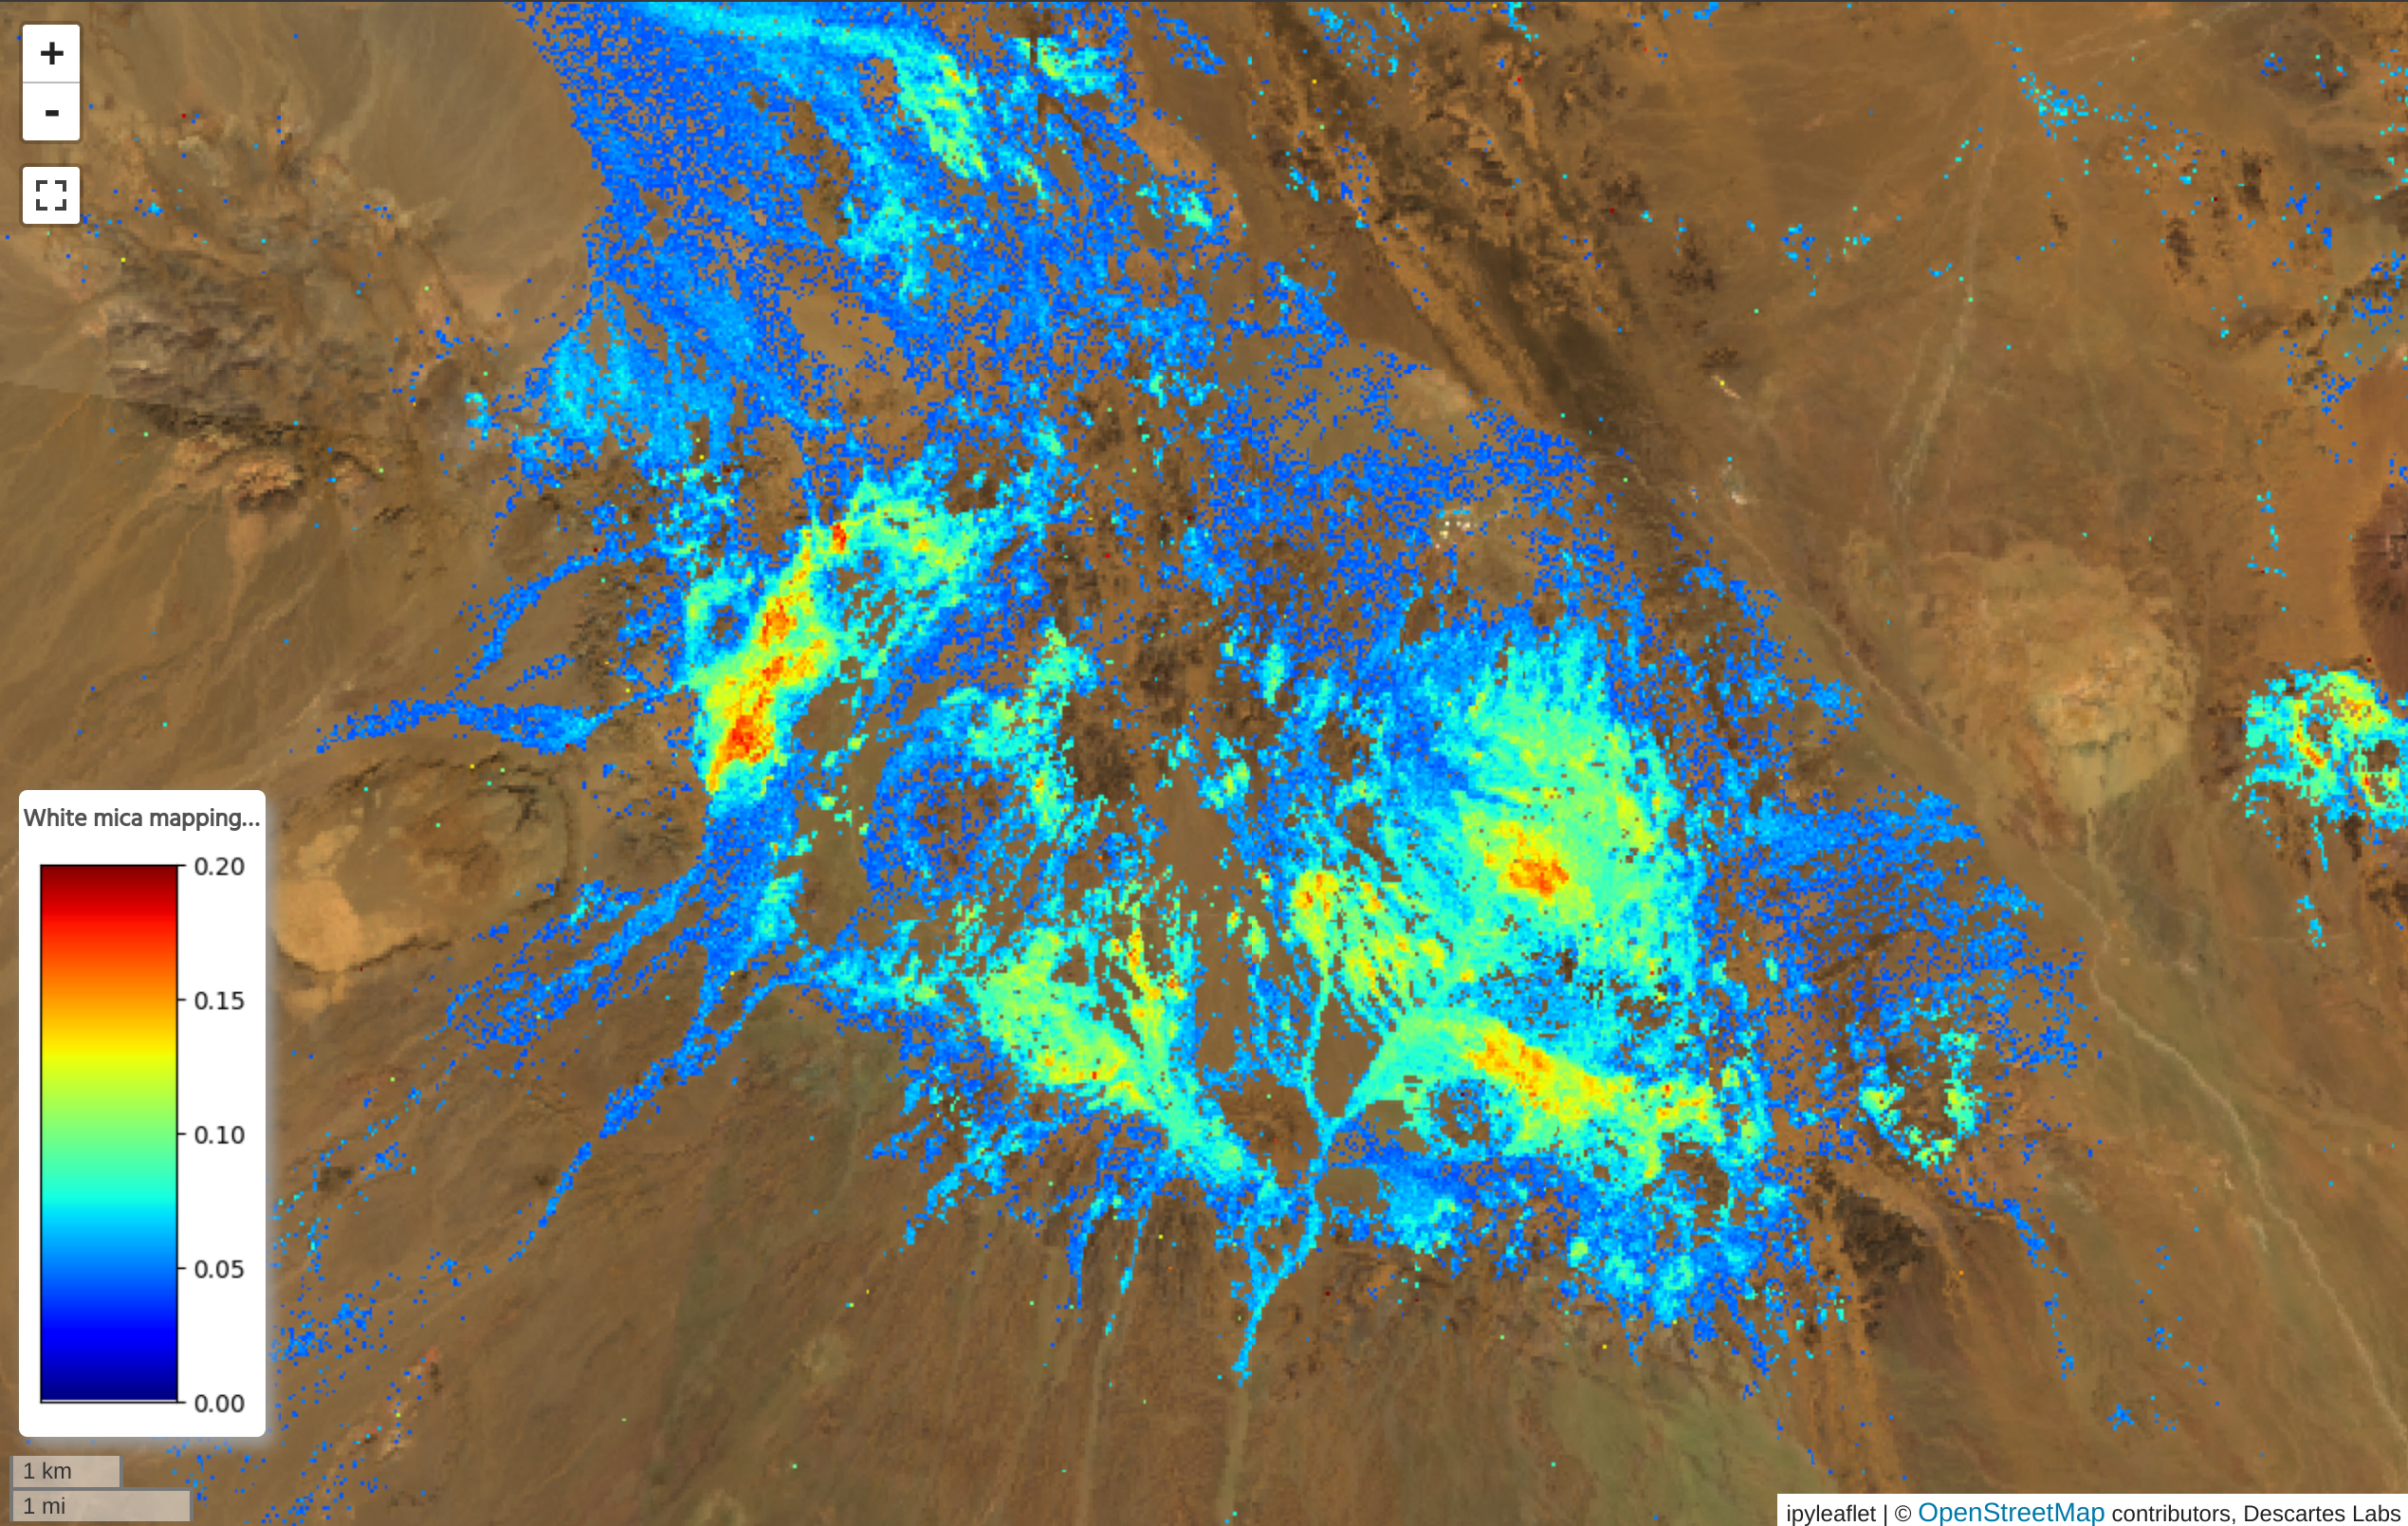
The Compositional mapping toolkit is used to combine absorption features and indices from a hyperspectral dataset in order to identify mineral composition. For example, an absorption at approximately 2200nm can indicate white mica, with the specific wavelength at which the spectrum is minimized identifying the mineral species. The final outputs from this dialog are abundance and composition layers for the given mineral.
Tip
Many case studies are available describing the techniques used in this toolkit, in a variety of geologic regimes. For example, studies are available in Iran and Pakistan. For a thorough exploration of spectroscopy in mineral identification, see this guide.
Compositional mapping starts with choosing the raster layer that will be used for the mapping.
Note
Only hyperspectral data can be used with this tool.
Choosing a mineral
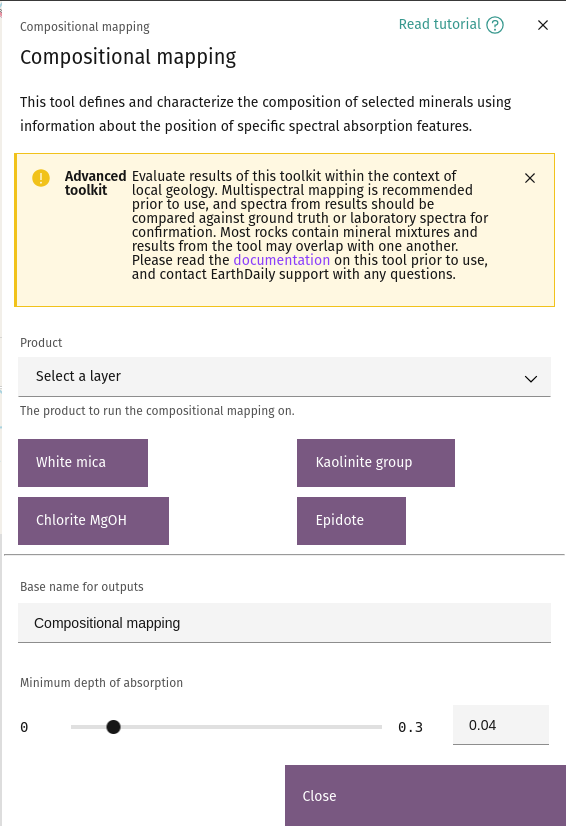
Each of the buttons for a given mineral use a set of absorption points and indices defined in the literature. Clicking one of the minerals will generate the composition and abundance maps. For information on how each map is computed, see the mineral definitions section.
Mask output layers
Once the output layers for the chosen mineral are computed, the slider will control the minimum "strength" of absorption required for a pixel to be chosen in the output map. The spectra above show a spectral query of an expected White Mica pixel in EnMap data before and after hull normalization. The value of the slider represents the depth of both the raw and normalized spectra.
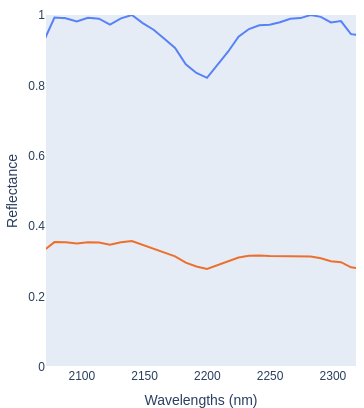
In this example, we can see that the minimum point of the hull normalized spectrum is approximately 0.8, meaning that this pixel will be chosen as long as the value of the slider is less than 0.2. In the raw spectrum, the slider references the difference between the maximum and minimum values.In this case, the value is approximately 0.05.
Mineral definitions
Each pre-defined mineral map is generated with a combination of absorptions and indices.
Note
Minerals are defined following the schemes in these works:
Asadzadeh, S., Chabrillat, S., Cudahy, T., Rashidi, B., & de Souza Filho, C. R. (2024). Alteration mineral mapping of the Shadan porphyry Cu–Au deposit (Iran) using airborne imaging spectroscopic data: Implications for exploration drilling. Economic Geology, 119(1), 139–160. https://doi.org/10.5382/econgeo.5041
Asadzadeh, S., Zhou, X., & Chabrillat, S. (2024). Assessment of the spaceborne EnMAP hyperspectral data for alteration mineral mapping: A case study of the Reko Diq porphyry Cu–Au deposit, Pakistan. Remote Sensing of Environment, 114389. https://doi.org/10.1016/j.rse.2024.114389
White mica
White mica abundance and composition are defined by:
- An absorption at 2200nm, computed on the spectrum from 2120nm-2245nm
- An index for absorption at 2350nm
- An index for absorption at 2160nm, used as a constraint to avoid Kaolinite
Kaolinite group
Kaolinite group abundance is defined by:
- An absorption at 2200nm, computed on the spectrum from 2120nm-2245nm
- An index for absorption at 2160nm
MgOH Chlorite
- An absorption at 2340nm, computed on the spectrum from 2174nm-2392nm